1. What would an AI bubble look like?
A bubble is a situation in which asset prices come to depend on expectations that future results may struggle to support. There is no public gauge that lights up the moment this happens. The debate involves estimates of growth, margins, competition, interest rates, and how long investors are willing to wait.
For AI, three questions help organize the discussion:
| Question | What we need to observe |
|---|---|
| Does the technology deliver value? | Quality, time saved, and the problems it solves. |
| Can the company capture that value? | Pricing, retention, costs, and the money left over. |
| Was the investment bought at a reasonable price? | How much future success is already reflected in its market value. |
A user can save hours with a tool while its provider loses money serving them. A provider can be profitable and still be too expensive for someone buying its shares. And infrastructure can eventually become very important after causing losses for those who financed it first.
That is why the personal experience of using AI every day answers only part of the question. Useful applications do not demonstrate that every project, valuation, and contract in the sector will pay off. Nor does a huge investment alone demonstrate that it is excessive: the relevant comparison is with demand and the cash that investment could generate.
2. A closer look at the video’s argument
Átila’s central thread is interdependence. Chipmakers need buyers; cloud providers need customers to fill their servers; labs need capital and computing power; investors need to believe that future revenue will justify building all of it.
The historical explanation gathers momentum at 04:33. The discussion of relationships between AI companies starts at 14:22, and equipment longevity comes up at 25:21. These passages offer entry points into three questions: who puts up the money, who takes the risk, and when does the return arrive?
The Enron comparison requires precision. The SEC documented the court ruling that established former CEO Jeffrey Skilling’s liability for fraud. That case shows how complex structures can make a business harder to understand. It does not establish that a cross-investment or a company formed for a data center project is inherently fraudulent.
Átila himself makes an important distinction at 21:30: current structures can be disclosed and auditable while still carrying financial risk. That is the most useful comparison for this article. The question is how much of the growth would withstand reduced financing, lower margins, or some customers struggling to pay.
3. A fact check that changes the reading: NVIDIA’s “70%”
At 17:14, five customers are linked to 70% of NVIDIA’s revenue. The Q2 fiscal 2027 10-Q instead reports their 70% share of accounts receivable (p. 13). For quarterly revenue, it disclosed one direct customer at 16% (p. 22). It did not identify the customers.
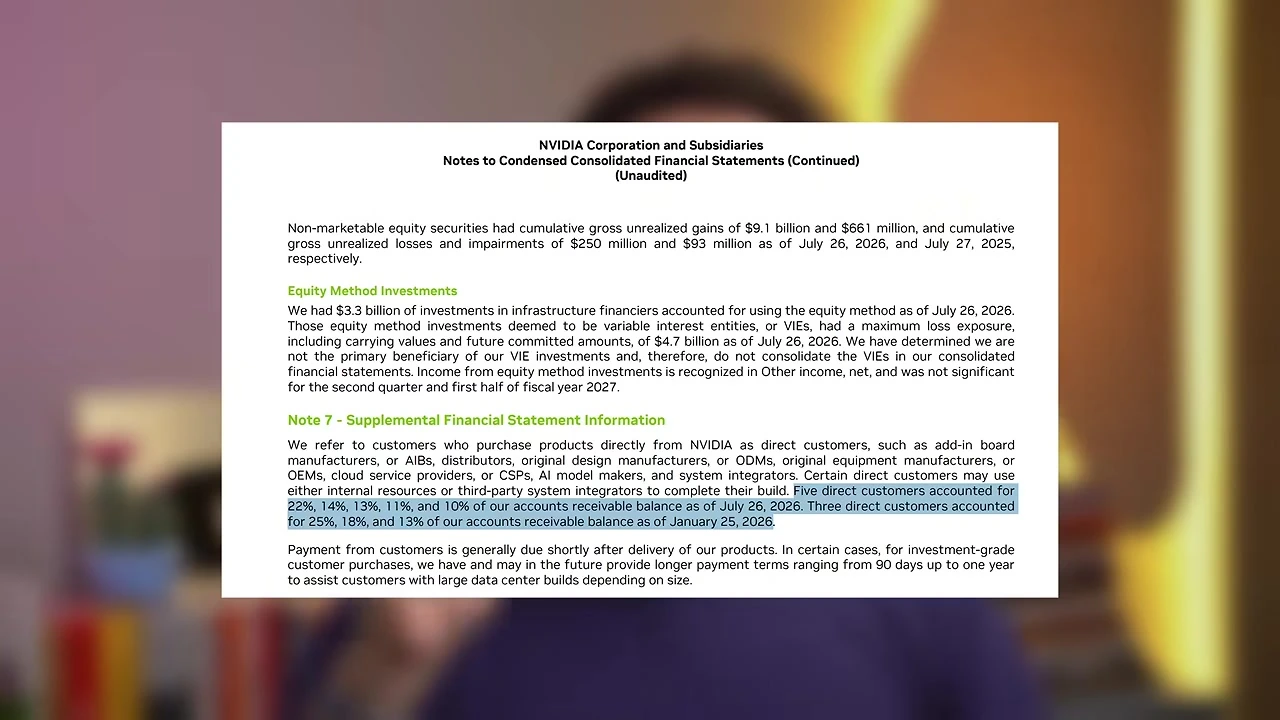
Compare the language transition in the video
Silent excerpt, played once. The animation loads only when the button is clicked. Open original excerpt.
Reduced motion: use the still above or open the original video.
Accounts receivable are amounts customers still owe on a particular date. Revenue measures sales recognized over a period. The concentration of outstanding bills and the concentration of sales can differ. Both matter to the analysis, but they answer different questions.
The video also extends the relationship between OpenAI, Anthropic, and infrastructure providers in a way that does not support the conclusion that the two labs account for 70% of all those companies’ total revenue. Total revenue, revenue from AI computing, and new contracts each need their own denominator. This caveat weakens one numerical formulation in the video while leaving the question of supplier and customer dependence open.
4. Following the money
Imagine a supplier investing in a lab. The lab uses some of the proceeds to buy computing services from that supplier. The transaction can fund real research and infrastructure. The point to watch is that two announcements—an investment round and a computing purchase—may represent stages of the same financing.

Scroll horizontally to explore the full diagram.
There are public examples of these intertwined relationships. In February 2026, OpenAI announced a US$110 billion funding round, with US$30 billion attributed to NVIDIA and US$50 billion to Amazon. The announcement links capital to capacity expansion. It does not say that all the money had been received by that date.
Another example is the AMD–OpenAI agreement announced in October 2025. The stock purchase warrant allows the purchase of up to 160 million AMD shares subject to specified milestones. It is an incentive tied to the commercial relationship, rather than an ownership stake already transferred in full.
Economic risk increases when several participants need the same optimistic scenario to materialize. A lab may depend on another funding round to honor its contracts; a cloud provider may depend on those contracts to finance servers; a lender may depend on the equipment’s resale value. If demand disappoints, the problem can reach more than one balance sheet.
But that chain of inferences has limits. Companies with diversified businesses have other sources of revenue and different abilities to absorb losses. Trouble at one lab does not automatically imply that all its suppliers become insolvent. Estimating contagion would require knowing the contracts, guarantees, maturities, each party’s exposure, and alternative uses for the capacity.
5. Six numbers that cannot mean the same thing
Much of the confusion disappears when every figure has a unit, a date, and a definition.
| Measure | What it means | What it does not demonstrate on its own |
|---|---|---|
| Announced investment | Capital intended to be invested, sometimes in stages. | Money available in full today. |
| Valuation | The value assigned to a company in a transaction. | Cash raised or profit. |
| Revenue | Sales recognized over a period. | Money left after costs. |
| Annualized revenue | A recent pace extrapolated over twelve months. | Actual revenue for a completed year. |
| Contracted backlog / RPO | Contracted services yet to be recognized as revenue. | Immediate payment or guaranteed margins. |
| Free cash flow | In one common definition, operating cash flow minus investment in assets. | An identical measure across companies without checking adjustments. |
Oracle disclosed US$664 billion in remaining performance obligations for the quarter ended August 2026. That measures future commitments, while its total quarterly revenue was US$19.3 billion. Comparing the two helps reveal the gap between promising capacity and delivering the service.
We also need to distinguish financial debt, leases, purchase commitments, and contingent obligations. They can put pressure on cash in different ways. Adding them all together under the label “hidden debt” removes essential information about maturities, cancellation rights, and accounting recognition. Being absent from a particular balance-sheet line does not mean being hidden from public documents.
The same care applies to GDP comparisons. Annual spending, investment accumulated over several years, and contributions to GDP growth have different denominators. I have not adopted the video’s percentage comparison as this article’s own measure, because doing so would require reconstructing the series, the period, and which spending belongs in the calculation.
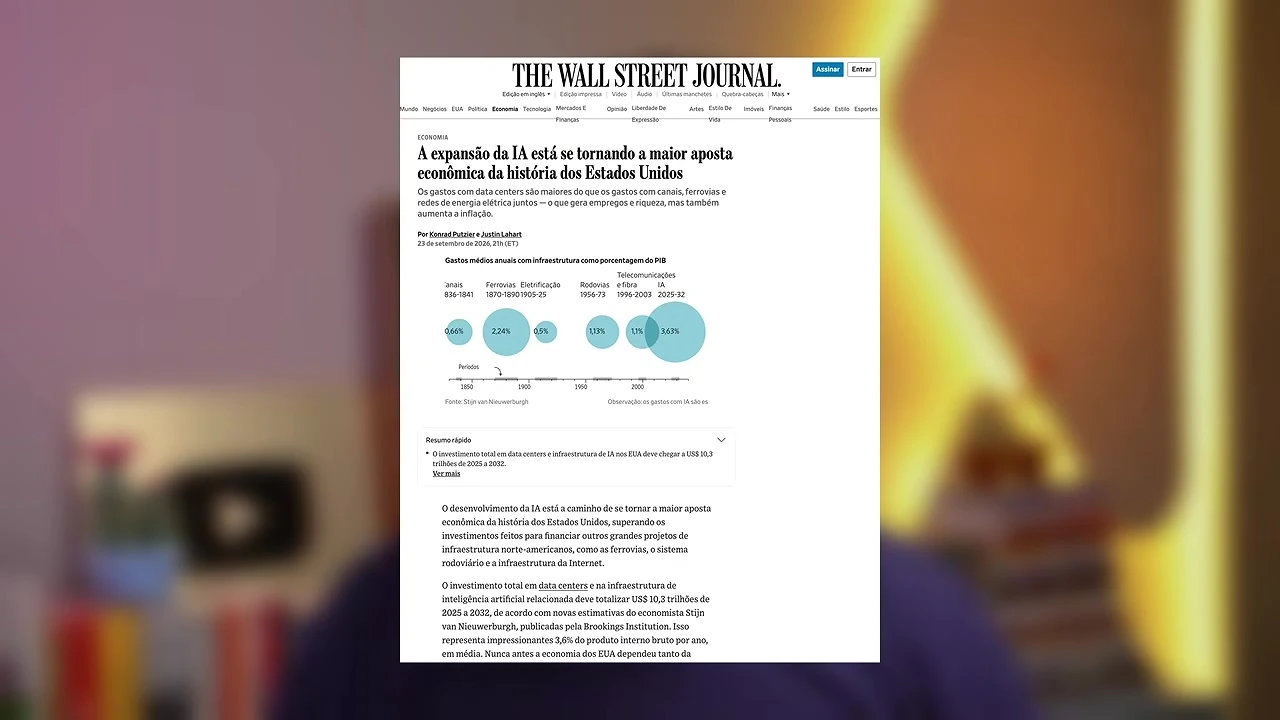
The chart shown at 23:52 compares annual averages of infrastructure investment as a share of GDP. Its AI bar covers 2025–2032 and includes projections. The image helps explain the historical argument; it should not be read as actual spending in a single year, 2026.
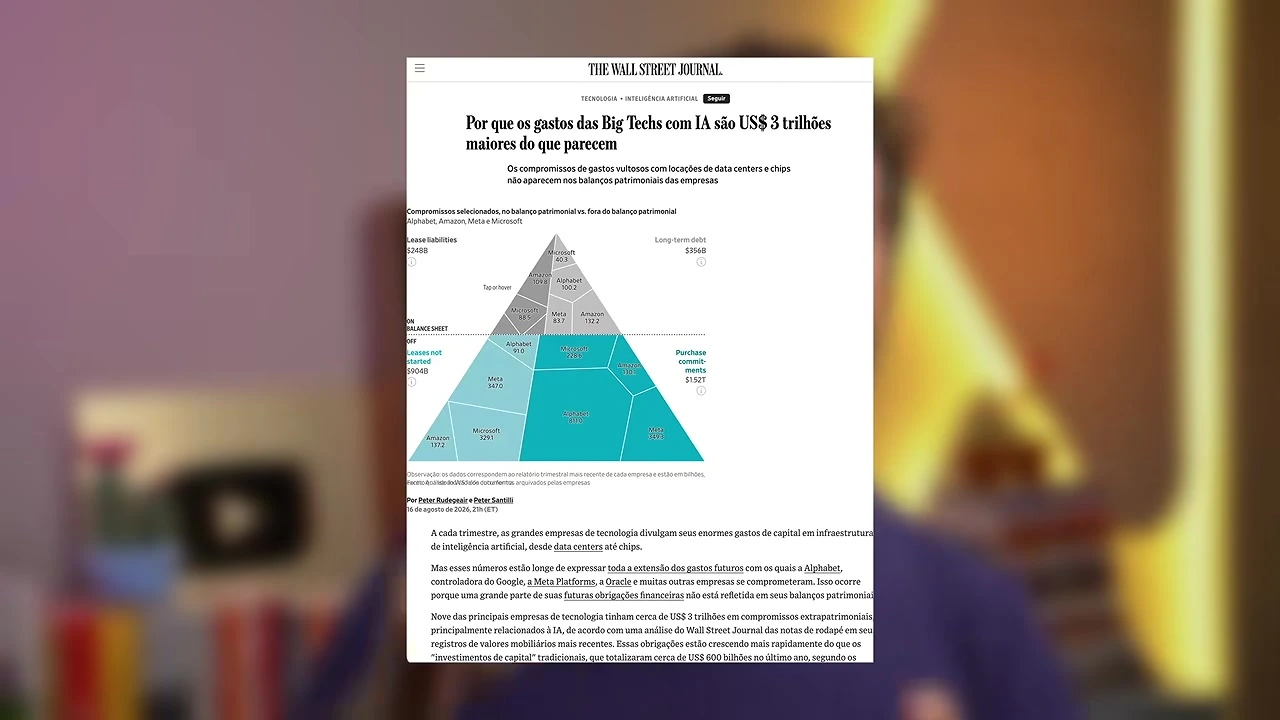
6. Chips age. The accounting needs to keep up
A data center combines assets with different economic lives: land, buildings, electrical connections, cooling, networking, and accelerators. The physical infrastructure may remain useful for a long time; a chip’s competitiveness changes with the cost and performance of new generations.
That does not create a universal date on which a GPU becomes useless. Older equipment can handle less demanding tasks or remain attractive as its price falls. Compatibility, power requirements, cooling, software, and cost per task all influence that decision.
Depreciation allocates an asset’s cost over its estimated useful life for accounting purposes. Economic loss of value is the decline in value or competitiveness in the real world. The two need to inform one another, but they do not necessarily move at the same pace.
Scroll horizontally to explore the full diagram.
In a hypothetical example, a US$6 million piece of equipment with no residual value generates US$2 million in annual depreciation over three years, or US$1 million over six. The initial cash outlay stays the same. Accounting profit changes with the expense recognized; the money spent on the purchase does not reappear.
Estimates can also be shortened. Amazon reported reducing the useful life of some servers and networking equipment from six to five years in 2025. The revision increased that year’s depreciation and amortization by US$1.4 billion. This shows how sensitive the accounting is to the estimate, without proving misconduct.
A decisive question is whether the equipment will keep generating enough cash throughout the period in which the company expects to use it. If the answer changes, the project may require revised estimates, accounting losses, or additional investment. Each case depends on utilization and the economics of the tasks the equipment can still perform.
7. Investment meets the power grid
Buying accelerators is only one step. They need completed infrastructure, available electricity, and customers using the capacity. A delay in connecting to the grid postpones revenue while interest, contracts, and some costs keep running.
The IEA estimates global data center electricity consumption at 485 TWh in 2025 and projects 950 TWh in 2030, roughly 3% of the world’s electricity that year. These are all data centers, not just AI; 2030 is a projection. The report highlights grid and equipment bottlenecks and the uncertainty created by efficiency gains and changing uses.
Electricity use by global data centers
- 2025 · IEA estimate
- 485 TWh
- 2030 · IEA projection
- 950 TWh
A global average also says little about the impact on a particular town. Water, available generation, transmission, and tariff rules depend on location. The local question is who finances the expansion, who benefits, and who remains exposed if a large consumer scales back its activity.
Greater efficiency per query can lower costs and encourage more use. Video, extended reasoning, and agents can increase the work done per request. The future of AI energy use therefore depends on a combination of user numbers, frequency, task type, and efficiency—not a single figure for “energy per question.”
8. The real bill: revenue, expenses, and subscriptions
To understand the scale, the simulator now starts with figures reported for the same calendar year, 2025, and subscription prices checked on October 22, 2026. Those dates serve different purposes: historical results show that year’s finances; current prices express their scale in something familiar.
For OpenAI, reporting by Ed Zitron, corroborated by the Financial Times, describes approximately US$13.1 billion in revenue, US$34 billion in costs and expenses, and a US$20.9 billion operating loss in 2025. The publication presents historical results rather than a forecast of future sales. Total spending was roughly 2.6 times revenue.
For Anthropic, Reuters reviewed a confidential prospectus: approximately US$4.6 billion in revenue and US$12.65 billion in 2025 expenses, including US$7.33 billion of compute/infrastructure. Expenses were roughly 2.75 times revenue.
Those figures support the existence of large operating deficits in that year. The evidence comes from private documentation described by journalists; we have not inspected the complete statements. The companies’ classifications are not identical, either. These sources do not let us precisely separate training from inference spending for both businesses.
Scroll horizontally to explore the full diagram.
Reported finances · 2025
The scale of costs and subscriptions
2025 finances and 2026 prices, in a scale comparison that does not estimate profit.
Confidential documents reported by the press; these are not public audited financial statements.
Changes the 2025 figures and available plans. The bars retain the same scale across companies.
OpenAI · 2025
- Revenue
- US$ 13.1billion
- Expenses
- US$ 34.0billion
- Reported operating loss
- US$ 20.9billion
What expenses include
- Cost of revenue
- US$ 7.50 billion
- Research and development
- US$ 19.18 billion
- Sales and marketing
- US$ 5.73 billion
- General and administrative
- US$ 1.57 billion
A scale comparison
How many subscriptions would generate revenue equal to the 2025 loss?
Choose a plan. The number is calculated for 12 months of payments at the same price.
US-dollar list price with monthly billing. Team plans are per seat. Excludes taxes, discounts, and API usage.
ChatGPT Plus · US$ 20/month · 12 months
- Subscriptions maintained for 12 months
- ≈87.17 million
- Revenue per subscription over 12 months
- US$ 240.00
- Loss used in the calculation
- US$ 20.92 billion
The calculation: loss ÷ (monthly price × 12)
US$ 20.92 billion ÷ (US$ 20 × 12) ≈ 87.17 million
Current prices applied to a reported 2025 loss: this is neither an actual customer count nor a cost per user. API and enterprise contracts also contribute to company revenue. The calculation ignores incremental costs and does not estimate profit, cash flow, or break-even.
Sources, prices, dates, and data limitations
2025 results described by journalists from private documents. We have not inspected the complete statements. Reported totals and line items are rounded; these are not inference costs per subscriber.
The two sources use different expense classifications; this is not a gross-margin comparison. Compute is already included in expenses, not an additional cost.
Reported, rounded figures may not reconcile exactly. The comparison uses the numerical reference described in the source note, before display rounding.
2025 financial figures: Ed Zitron; Financial Times · . Financial Times (via Yahoo Finance)
Prices checked on . US-dollar list price with monthly billing. Team plans are per seat. Excludes taxes, discounts, and API usage.
- ChatGPT Go · US$ 8/month · monthly billing
- ChatGPT Plus · US$ 20/month · monthly billing
- ChatGPT Pro US$100 · US$ 100/month · monthly billing
- ChatGPT Pro US$200 · US$ 200/month · monthly billing
- ChatGPT Pro US$500 · US$ 500/month · monthly billing
- ChatGPT Business · US$ 25/month · monthly billing per seat
Subscription prices provide a reference for scale. One million subscriptions at US$20 per month, maintained for twelve months, equal US$240 million in annual gross sales. Dividing the historical operating loss by that amount produces tens of millions of equivalent subscriptions. The selector repeats the calculation with other real plans.
Prices come from the official OpenAI and Anthropic pages. The scenario uses monthly US-dollar billing before tax; annual discounts and per-seat conditions can change the calculation. Claude Pro, for example, also offers US$200 billed annually. Subscription and API prices are commercial revenue for the provider, not measures of its internal costs.
The equivalent number is calculated automatically: 2025 loss ÷ (the plan’s monthly price × 12). For example, the US$20.92 billion reference divided by US$6,000 a year for the US$500/month plan equals approximately 3.49 million subscriptions for one year. This compares revenue with a historical loss, without estimating how many customers would eliminate that loss: new customers also bring expenses. Calculating actual break-even would require knowing how much remains from each new subscription after the cost of serving it. Corporate revenue already includes different plans, APIs, and contracts.
Selling a service and financing research are different parts of the bill. In the OpenAI figures, reported cost of revenue is below revenue; the large loss emerges after other expenses, especially R&D. That prevents us from concluding that every individual subscriber receives more computing than they pay for. A very intensive user, the average paying user, and the entire business can have different economics. Cost of revenue should not be renamed “pure inference,” either.
Finally, 2025 does not automatically describe current profitability. In May 2026, Anthropic itself announced a revenue run rate above US$47 billion. That annualized pace is excluded from the comparison with 2025 annual expenses. Operating loss, net loss, cash burn, and future commitments also need separate lines: non-cash accounting adjustments can substantially change net losses.
9. Demand can grow while margins shrink
A company can attract many users while selling its service at a price that does not cover all its costs. That can be part of an expansion strategy, but the financing needs to last until the business can sustain itself.
There is also competition over where models run. At 32:38, Átila highlights Chinese models and the possibility of running them locally. The economic question matters: if cheaper alternatives can handle more tasks, a provider of more expensive models needs to justify the price difference.
Downloadable model weights expand the options, but total costs include hardware, memory, energy, maintenance, licensing, integration, and human work. Some models can run on a personal computer; others require servers. A local alternative also uses chips and electricity, and it may still be deployed in a cloud.
The effect on investment is therefore ambiguous. Efficiency gains can reduce the capacity needed for each task, or make so many new tasks viable that total use increases. Likewise, cheaper models can expand the market while putting pressure on particular participants’ margins. That is a reason to question linear revenue forecasts based on growth in query numbers.
In its closing discussion, at 35:19, the video proposes that narratives about danger and regulation can also serve companies’ commercial interests. This is an interpretation of incentives. The material does not demonstrate that all safety concerns are pretexts or establish a general absence of technical progress. Assessing a system’s risks and assessing who benefits from a rule are questions that require their own evidence.
10. Productivity answers another part of the question
Productivity gains are one route to creating demand willing to pay. What matters is measuring the complete result: time saved after review, quality, errors, integration costs, and tasks that have become possible.
A study published in the Quarterly Journal of Economics followed 5,172 support agents and found an average 15% increase in issues resolved per hour with generative assistance. The effect varied with experience. The result matters for that setting; it does not measure the whole economy.
The initial METR experiment with experienced developers, meanwhile, found that tasks took 19% longer using early-2025 tools. In its February 2026 update, the team explained that the new data collection suffered from participant and task selection effects and did not provide a reliable estimate of the current effect. The study’s date and design are part of the result.
These studies should not be combined into an improvised average: they measure different people, tasks, and tools. They show why “I feel more productive” needs to be compared with an observable measure. And even a real gain does not automatically reveal how much will go to the worker, the customer, the employer, or the model provider.
11. How could this expansion end?
There is more than one possible adjustment. Some possibilities could occur at the same time:
| Scenario | What would happen | What would help identify it |
|---|---|---|
| Growth that pays for the expansion | Paying use and margins support installed capacity. | Improving operating cash flow, retention, and project returns. |
| Gradual adjustment | Expansion slows and asset prices fall without a widespread rupture. | Delayed projects, consolidation, and slower investment growth. |
| A crisis in part of the chain | A company or group cannot refinance its obligations. | Payment difficulties, renegotiation, and idle capacity. |
| Value shifts to other participants | AI spreads, but competition reduces some suppliers’ returns. | Growing use alongside lower prices and margins. |
These scenarios organize the evidence without assigning probabilities. The history of earlier technologies helps formulate questions, but it does not set a timetable. The video calls attention to obligations coming due over the next few years; that does not establish a proven date for a bubble to burst.
To follow the issue, I would focus on the conversion of contracts into revenue, revenue into cash, and built capacity into paying utilization. I would also look for changes in financing conditions, customer concentration, and estimates of equipment useful lives.
12. What I take from this investigation
The video is valuable as an invitation to look behind the announcements and follow the money. Checking the sources made the question more specific: how much of this system can sustain itself through customers paying for the value they receive, for long enough to earn a return on the capital invested?
There are useful applications, large investments, and risks that are hard to measure. That calls for care both with certainty that everything will pay off and with certainty that a collapse already has a date. The correction to NVIDIA’s 70% is an example of why a good question needs to survive scrutiny of the numbers used to present it.
For people who use AI, the issue also concerns dependence on services, continued access, energy costs, and alternative ways to run models. The financial outcome of this expansion can affect tools that are already part of everyday work, even for people who have never bought a share in the sector.
Sources and method
The video was downloaded for private study. The complete audio underwent independent automatic transcription, which was compared with YouTube’s captions. The computational scan decoded all 53,679 video frames to detect changes; visual interpretation used 18 contact sheets, selected scenes, and the frames cited in the text. This does not amount to a human reading of every individual frame.
The reproduced frames are excerpts from Átila Iamarino’s video, selected to comment on its content, with attribution, timestamps, and links. The diagrams and simulator are original explanations created for this article. The energy figures are presented with attribution to the IEA. The full transcript and complete media are excluded from the publication package.
Corporate documents show what companies have disclosed; their announcements do not independently verify that their plans have been carried out. The text distinguishes observed data, projections, and hypothetical examples. This is an explanatory analysis, without investment recommendations.